
Key takeaways:
- The technology adoption curve comes from Everett Rogers' Diffusion of Innovations, first published in 1962, which details how new ideas and practices spread.
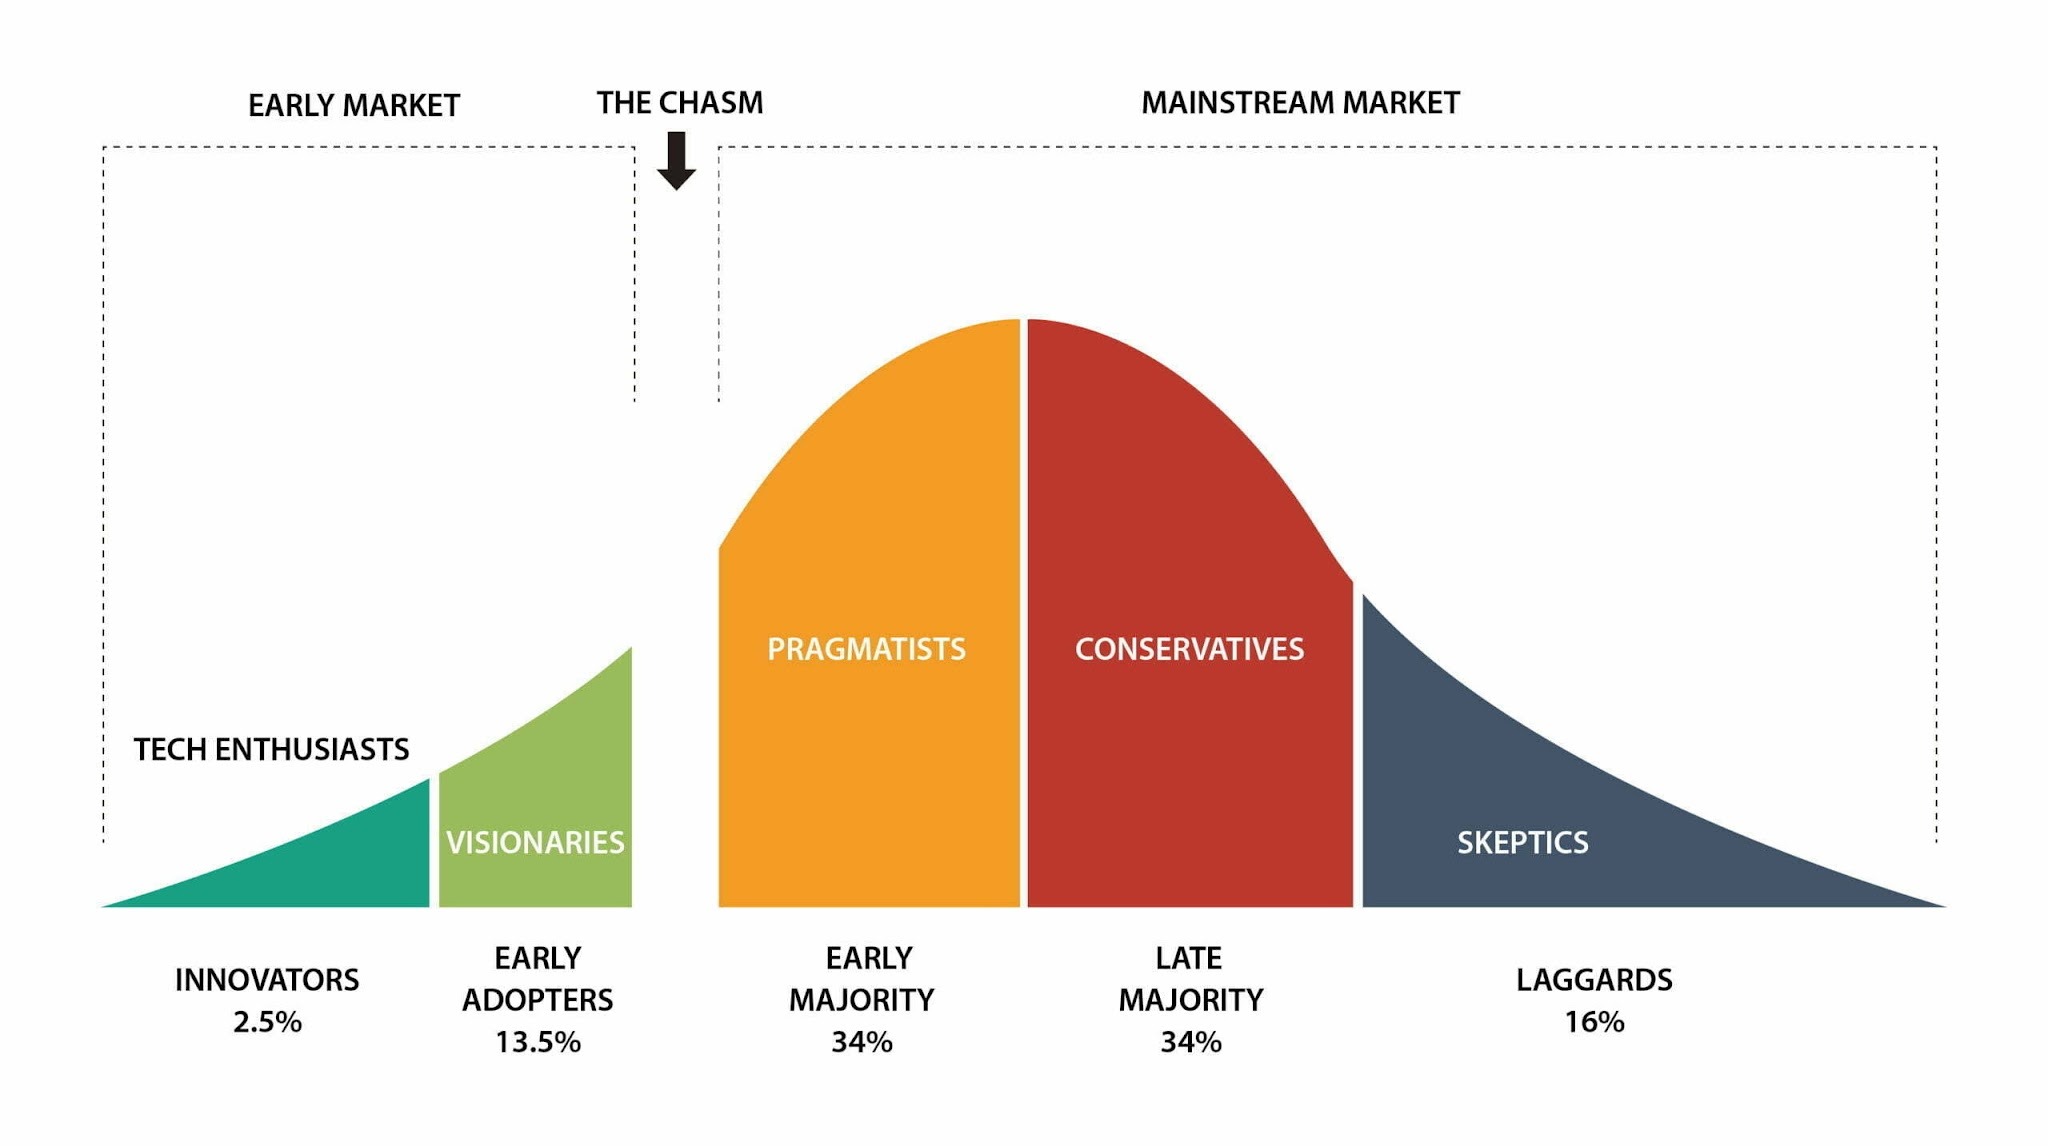
- Rogers divided adopters into five categories: innovators (2.5%), early adopters (13.5%), early majority (34%), late majority (34%), and laggards (16%).
- For many new technologies, the hardest transition is from early adopters to the early majority — the gap Geoffrey Moore described as “the chasm.”
- The same curve applies inside companies: employees take up new software at different speeds, so each group needs a different kind of support during a rollout.
New technology doesn't spread evenly. A small group of enthusiasts tries it almost immediately, most people wait until it's proven, and some only switch when the old option disappears. That's true of smartphones and electric cars, and it's just as true of the new software your team was asked to start using last quarter.
The technology adoption curve describes this pattern. It splits adopters into five groups, from innovators to laggards, and explains what each group needs to see before it commits to something new.
Below, we cover where the model comes from, the five adopter categories, the chasm where many products stall, and three real-world examples of technology adoption in practice. We'll also look at how the same curve plays out when a company rolls out new software internally, and what that means for training.
What is the technology adoption curve?
The technology adoption curve, also called the innovation adoption curve, is a sociological model that shows how people accept and use new technology over a period of time. This model was introduced by Everett M. Rogers in his book Diffusion of Innovations, first published in 1962 and most recently revised in 2003.
Rogers' broader theory explains how, why, and how quickly new ideas, behaviors, and technologies spread through a culture or social system over time. As for the technology adoption curve, the model is usually drawn in two ways:
- The bell curve: Shows the number of individuals who adopt technology at any given time. Innovators are followed by a growing number of individuals until the majority of the population has adopted, and the curve gradually declines as the last holdouts come on board.
- The S-curve: Adds up all the individuals in the bell curve graph to display the entire market that has adopted the new good or innovation up to that point in time.
In other words, the bell curve shows which group is adopting right now, while the S-curve shows how much of the potential market has already adopted and how much remains. Both curves describe behavior toward a specific technology, not fixed personality types: the same person can be an innovator with gaming hardware and a laggard with accounting software.
The five adopter categories
In Diffusion of Innovations, Rogers describes five adopter categories. They run from the first people to try an innovation to the last, and each group has its own reasons for adopting or rejecting it.
Source: Omniplex Learning
Innovators (2.5%)
The first 2.5% on the technology adoption curve are risk-takers who aren't afraid to try out new technology. They're either involved in technology themselves, like engineers and AI researchers, or are tech-savvy and comfortable with risk. In some cases, innovators become the main initiators and backers of a new technology, helping to establish and scale it.
| What they need | What makes them say no |
| Exclusive access and the opportunity to try and test innovations. | A product that isn't actually novel, or one they can't get their hands on and tinker with. |
Early adopters (13.5%)
Early adopters are similar to innovators, but the main difference is that they're visionaries, interested in the actual potential and application of new technology. Think of business owners and entrepreneurs looking for a competitive edge – Rogers found that this group has the highest degree of opinion leadership.
| What they need | What makes them say no |
| A compelling vision and a strategic advantage, either personal or for business. | Common products that have no unique differentiation or strategic edge. |
Early majority (34%)
People who are part of the early majority are usually pragmatists who are looking to adopt a specific piece of technology with a deliberate purpose. For companies, winning over the early majority is often what opens up wider market audiences and turns a niche product into a mainstream one.
| What they need | What makes them say no |
| Clear evidence that a product works and has trusted reviews. | Ambiguous reviews and too much uncertainty surrounding the product. |
Late majority (34%)
This category groups conservatives who are risk-averse and only buy new technology after it's been thoroughly tested, verified, and used by others. Late majority buyers are mostly driven by real need rather than enthusiasm or hype.
| What they need | What makes them say no |
| Concrete proof that the product works, with sufficient support for reassurance. | Complexity, cost, and even a small indication of usability risks. |
Laggards (16%)
These are your common skeptics who are the most difficult to reach and convince. Laggards are often tradition-oriented people who prefer to use the tools and tech they trust without needing to change anything.
In many cases, they adopt only when the old technology is discontinued or replaced and they no longer have another option.
| What they need | What makes them say no |
| An unavoidable reason to adopt new technology that has a clear and beneficial use case. | The need to change, especially if the product isn't easily understood or comes with abstract benefits. |
The distinction that matters most
One of the most useful lines in this model is the one between the two middle groups. The early majority is pragmatic: they're open to new solutions as long as they work, so they look for evidence and references from peers who have already used them.
The late majority is more cautious. They don't need to be convinced that a technology is useful – they need reassurance that it's established, safe to adopt, well supported, and unlikely to create new problems. That's why, once you've won over the early majority, reaching the late majority is less about adding features and more about reducing friction, cost, and risk.
Crossing the chasm
Geoffrey A. Moore published Crossing the Chasm in 1991, arguing that the needs of visionaries and pragmatists are so different that disruptive high-tech products often stall before they reach the mainstream market.
The technology adoption curve suggests a smooth flow from innovators to laggards. Moore argued that for advanced tech products, there is a gap – the chasm – between visionaries and pragmatists.
Why the gap exists
Moore describes the chasm as stemming from a fundamental difference in what visionaries and pragmatists want and expect from technology. Visionaries look for something new and exciting that they can use for personal or business gain to get ahead.
Pragmatists are the exact opposite – they want an established solution that presents a real improvement. They expect a product that's fully completed and reviewed by peers. To sell and position a product, you have to know your target audience and what they're looking for, because an exciting product prototype can attract visionaries but lose pragmatists.
What crossing the chasm requires
To get a product across, Moore recommends focusing on three things:
- Target an audience segment with a real need: Pick one specific niche of pragmatic customers with an urgent problem and build a product for that specific need.
- Create a complete solution: Pragmatists want a product that works in their environment from day one – what Moore calls the “whole product.” That means integrations, support, training, and documentation, not just the core features.
- Reference customers: References and positive reviews are crucial for creating social proof, which is often required by pragmatists.
The adoption process over time
Rogers' model describes who adopts and when. In practice, it helps to map those adopter groups onto the stages a product goes through as it grows. The four phases below aren't part of Rogers' original model – they're a practical way to connect the adoption curve to product lifecycle stages, with the chasm sitting between the first two.
- Launch: Adoption is slow and largely limited to innovators and early adopters. The product changes fast, so the main goal is to refine it using feedback from a small, targeted group of customers.
- Early growth and the chasm: Press coverage increases, the product gets closer to a finished version, and early adopters become vocal advocates. Adoption begins to grow, but this is also where many products stall: the company has to win its first pragmatic customers while keeping its focus narrow.
- Rapid growth: The early majority starts buying once the product is proven, supported, and recommended by peers. Competitors enter the market, and the focus shifts to scaling the company and delivering a reliable product and service.
- Maturity and plateau: Most of the potential market, including the late majority, has adopted. Growth now comes from replacing other products or from upgrades, and the focus shifts to pricing and refining existing features.
Signals that show which phase you're in
A few practical signals can help you identify where your product sits on the technology adoption curve. Look at who is buying, what they ask for, how deals happen, and how the market is growing.
| Who is buying | If most buyers are enthusiasts, specialists, or companies willing to tolerate rough edges, you're likely still in the early phase. |
| What they ask for | Early users tolerate bugs and ask for new features. When requests shift to integrations, compliance documents, contracts, and training, the early majority is usually arriving. |
| How deals happen | If new deals increasingly come through referrals, case studies, and reviews, pragmatists have likely started to adopt your product. |
| Growth rate and competition | Look at the rate of technology adoption in your market. A crowded, fast-growing market usually signals rapid growth, while slowing growth and price competition point to maturity. |
Real-world examples
These three cases show how the technology adoption curve plays out in practice, and what decides whether a product crosses the chasm or stalls.
Smartphones: crossed the chasm
Early smartphones such as BlackBerry and Windows Mobile devices gained traction mainly among business users and technology enthusiasts. They were built around email, calendars, and productivity, and they earned a loyal following in that segment.
The iPhone and Android devices later expanded smartphone adoption to a much broader consumer market. Touchscreens made them easier to use, and app stores let people tailor the phone to their own needs, turning it into a complete product for everyday life rather than a business tool.
Pew Research Center's 2011 survey found that 35% of US adults owned a smartphone – already well past the 16% that innovators and early adopters account for in Rogers' model. Ownership at that point was highest among younger, more affluent, and better-educated adults.
By 2025, Pew reported that smartphone ownership had reached 91%. As is typical in the later stages of diffusion, the last adopters skew older: 97% of 18–29-year-olds own a smartphone, compared with 78% of adults aged 65 and over.
As prices fell and mid-range devices improved, the smartphone went from a premium gadget to an everyday necessity – the point where even the late majority sees it as the default rather than a choice.
Google Glass: stalled, then retreated to a niche
The Google Glass project was sold to early users known as “Explorers” in 2013 for $1,500. After failing to generate sufficient consumer interest, Google ended consumer Glass sales in January 2015 and launched the Google Glass Enterprise Edition for business customers in 2017.
The product found a better fit in factories, logistics, and field service, where hands-free access to instructions solved specific, pressing problems – exactly the kind of narrow, pragmatic niche Moore recommends. Even so, that market never grew large enough, and Google discontinued Glass Enterprise Edition on March 15, 2023.
Google Glass shows how high cost, an unconventional design, privacy concerns, and the lack of a clear everyday use can keep a product from crossing the chasm in the consumer market. The enterprise pivot adds a second lesson: finding a niche is necessary, but the niche also has to be big enough to build on.
Electric vehicles: crossing in some markets, not others
Electric cars show that a product can cross the chasm in some markets while stalling in others. The early adopters were mostly wealthy tech enthusiasts, while early majority buyers wanted affordable, trusted vehicles from known brands and a reliable way to charge them.
The International Energy Agency (IEA) states that electric cars accounted for more than 20% of global new car sales, with over 17 million units sold in 2024. This means that one in five cars sold globally were electric.
In China, the share is even bigger: electric cars captured more than half of all car sales for the first time in 2025. In Europe, by contrast, sales stalled somewhat around 2024 before picking up again: in August 2026, EU battery-electric car registrations rose 62.7% year on year, according to ACEA. Price, charging infrastructure, and subsidies explain much of the difference between markets.
Strategies to move adoption forward
Technology adoption depends on the product, target audience, problem, industry, and use case. Some products are adopted quickly, while others need more time and effort to get through the chasm. That's why each adoption phase needs its own tailored strategy, rather than one approach applied across the whole curve.
- Sell the vision to innovators and early adopters: Give them access, solicit feedback, and keep them close. The product does not have to be complete. Founder involvement, beta testing, and bold positioning work well with these customers.
- When crossing the chasm, focus on a single customer segment: Build everything that this first pragmatic customer needs to succeed. Make those first customers visibly successful. Success stories, industry-specific messaging, and partners are more important than new features.
- Sell reliability and fit to the early majority: Show references from similar organizations and get integrated with tools they already use. Invest in onboarding, customer service, and documentation. Position the product as the emerging standard rather than the exciting newcomer.
- Reduce risk and improve the experience for late majority and laggard customers: Simplify the offering, lower the price, bundle with other goods and services they already buy, and make switching as painless as possible. Sometimes the best option is to build the technology into something customers already use.
Common mistakes
Even with the right strategy, companies often make one of these three mistakes:
- Using early-adopter messaging on the early majority: Words like “revolutionary” and “disruptive” excite early adopters, but to the early majority, these terms can cause suspicion and uncertainty. Mainstream buyers want to hear words like “proven,” “compatible,” and “supported.”
- Treating resistance as irrational: Late adopters have real concerns that need to be addressed and viewed seriously. Ignoring these concerns can lead to your product stalling or failing to fully establish in target markets.
- Mistaking early traction for product-market fit: Sales to early adopters who love your product and vision are not the same as product-market fit for the mainstream. Track sentiment and adoption rates side by side, and adjust your growth strategy accordingly.
What you can and can't influence
In technology adoption, the major areas a company can control are product, price, positioning, target audience, support, and partnerships. Network effects, government regulation, the underlying infrastructure, the economy, and culture are outside of a company’s control.
In the EV market, for example, carmakers controlled range and price, but charging networks and subsidies had a huge impact on adoption.
The adoption curve inside organizations
The same technology adoption curve also describes how employees take up new software, such as a CRM, a project management tool, or an AI assistant rolled out as part of a digital transformation. A few enthusiasts try it first, the majority waits to see whether it actually helps, and a resistant tail sticks to the old way of working.
The main difference is that employees usually aren't deciding whether to buy the technology. That decision has already been made, so resistance rarely looks like a refusal. Instead, it shows up as low usage, old spreadsheets that never get retired, workarounds, and teams following inconsistent processes for the same task. The tool is live, but the behavior hasn't changed. That's why a good ERP implementation plan tracks adoption after go-live, not just the launch date.
That's why you can't market your way across the chasm internally. What moves the early and late majority is visible peer usage, a new workflow that actually ends up improving productivity instead of adding steps, and guidance that's available when people need it – not just in a one-off training session at launch.
In practice, each adopter group needs a slightly different rollout approach:
| Adoption group | Internal rollout approach |
| Innovators | Give early access and let them explore |
| Early adopters | Show what the tool can improve and involve them as champions |
| Early majority | Provide proven workflows and practical training |
| Late majority | Reduce friction and make guidance easy to access |
| Laggards | Make the new process simpler than old workarounds |
This is where training becomes part of the adoption strategy. Early users may be comfortable exploring a new tool on their own, but the early and late majority need clearer guidance around the workflows they are expected to use – how to log a deal in the new CRM, how to submit a request, how to run the weekly report. A general feature tour doesn't answer those questions; a guide to the actual workflow does.
Here's what a workflow-level guide looks like in practice – importing contacts from a CSV file into Salesforce, step by step:
With Guideless, teams use a browser extension to capture real software workflows as they perform them and turn them into narrated videos and step-by-step guides that employees can open whenever they need them.
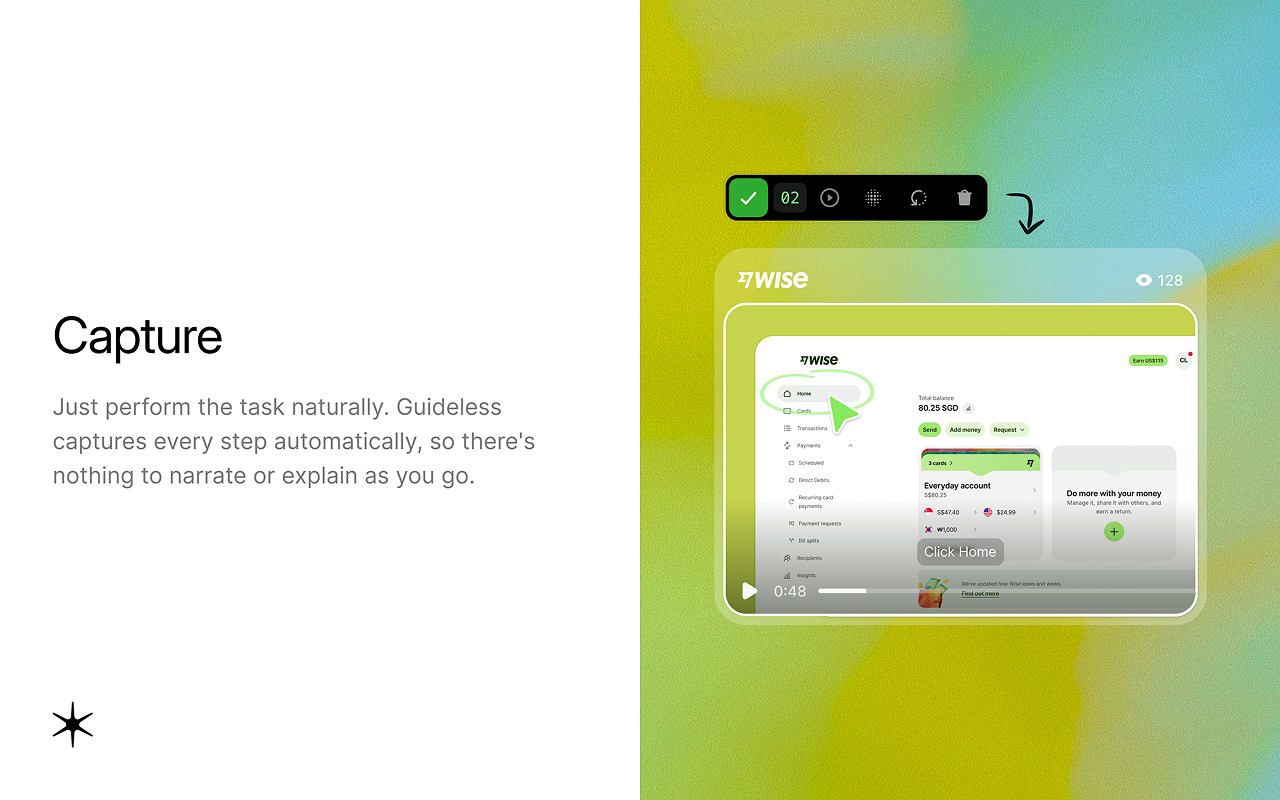
That helps every group get up to speed faster on the tools they actually use. When a workflow changes, you update only the affected steps instead of recreating the entire guide.